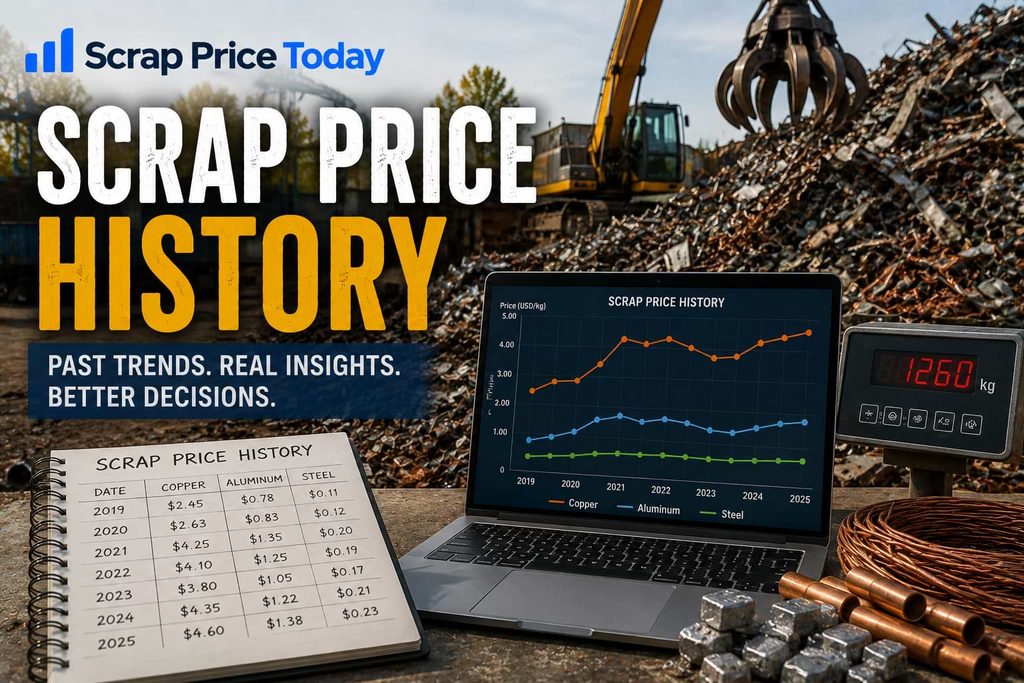
Over five years our series shows copper scrap up 57.3 percent and brass up 51.6 percent, while ferrous is down 21.8 percent and lead is down 20.9 percent. The idea that scrap prices have boomed is true only for the copper family. Two of the six grades we track are worth less than they were five years ago.
Scrap Price Today market analysis, written from exchange settlement data, mill and refiner pricing practice and published policy documents. Figures are examples; today’s numbers are on the live scrap price board.
We hold 1,258 daily observations for copper and brass and 1,359 for the ferrous and monthly-sourced grades, going back to the middle of 2021. This is what that history actually says, and where the turning points sit.
Five years, six grades
| Copper | Brass | Aluminium | Zinc | Ferrous | Lead | |
|---|---|---|---|---|---|---|
| Measurement | USD per lb | USD per lb | USD per lb | USD per lb | USD per short ton | USD per lb |
| Today | $5.86 | $3.57 | $0.84 | $0.90 | $300 | $0.59 |
| One year | +52.6% | +49.5% | +32.2% | +22.4% | +11.7% | -5.8% |
| Three years | +79.5% | +75.4% | +57.5% | +46.8% | +10.1% | -13.6% |
| Five years | +57.3% | +51.6% | +22.0% | +8.6% | -21.8% | -20.9% |
| Series high | $5.86, today | $3.57, today | $1.05, late May | $1.09, April three years ago | $438, April three years ago | $0.77, five years ago |
| Series low | $2.79, July four years ago | $1.86, July four years ago | $0.52, August three years ago | $0.59, February two years ago | $251, November four years ago | $0.59, last month |
Read the bottom two rows together and the shape of the last five years becomes clear. Copper and brass are making their highs today. Aluminium, zinc and ferrous made theirs in the spring three years ago and have not been back. Lead is making its low right now.
The spring that split the market
Almost every metal on our board except copper peaked within weeks of each other in the early spring three years ago, during the commodity shock that followed the invasion of Ukraine. Energy costs, shipping disruption and sanctions risk lifted everything at once.
What happened next separated them permanently. Aluminium fell 46.5 percent from that peak over the following seventeen months, our deepest recorded drawdown for any grade. Ferrous dropped from $438 to $251 a short ton within seven months. Zinc halved over two years.
Copper had its own drawdown, 34.9 percent, but it was compressed into four months and it recovered. That difference, a sharp fall that mean-reverts against a long grind that does not, is the clearest lesson in the whole dataset for anyone deciding whether to hold material.
Why copper separated from the rest
The divergence is not random. Copper demand has a structural story the others lack: grid replacement, electrification and data centre construction all consume it in quantities that were not in anyone’s forecast five years ago, while mine supply has been repeatedly disrupted.
Brass tracks copper because it is mostly copper by weight, which is why the two lines in our series are almost parallel.
Ferrous went the other way for a reason we can now measure: protection landed on finished steel rather than on the raw material, and mills captured it. Finished steel rose 44.8 percent over the last year while the scrap feeding it rose 11.7 percent, which our steel analysis works through using company filings.
What a five-year view is good for
It is not a forecast. It is a way of calibrating what normal looks like for each grade, and three things stand out.
- Range: copper has traded across a 110 percent range in five years, aluminium 103 percent, ferrous 74 percent, lead only 31 percent. A grade that moves in a narrow band rewards patience far less than one that does not.
- Drawdown: aluminium’s worst peak-to-trough fall was 46.5 percent, copper’s 34.9 percent. That is the size of loss a collector holding inventory has historically had to sit through.
- Recovery time: copper’s deepest fall lasted four months, aluminium’s seventeen. The time cost of being wrong differs enormously by metal.
That context is worth more than a target price, and it is why we publish the charts with a five-year range rather than a rolling month.
What it means for a seller today
- Copper and brass are at their series highs. Every level on the way up looked like a peak too, so a sorted load sold now is not a mistake.
- Aluminium is 20 percent below its May peak but still well above its lows. The twelve-month chart and the three-month chart disagree, and the three-month one is the current information.
- Ferrous is worth less than five years ago in nominal terms, before inflation. Preparation and grade separation matter more here than any timing decision.
- Lead is at its series low. Battery scrap prices follow it, which is why that pile is paying less than people expect.
Key numbers
- Copper is up 57.3 percent over five years, brass 51.6 percent, aluminium 22.0 percent, zinc 8.6 percent; ferrous is down 21.8 percent and lead down 20.9 percent (Scrap Price Today series, 1,258 to 1,359 daily observations per grade).
- Aluminium’s deepest recorded drawdown was 46.5 percent, running seventeen months from the spring peak three years ago.
- Copper’s deepest drawdown was 34.9 percent and lasted four months.
- Ferrous fell from $438 to $251 a short ton within seven months after its peak.
- Copper has traded across a 110 percent range over the period; lead across 31 percent.
What this metal pays around the world
Scrap is a global market priced in US dollars, but what reaches a seller depends on trade position, freight to the nearest consumer and how many buyers compete locally. The table below converts the same grade into each market’s own currency and units at the day’s exchange rate, and shows the factor we apply.
| Market | Local price | USD per lb | Market factor |
|---|---|---|---|
| Turkey | ₺633.98 / kg | $5.79 | 1.04 |
| Germany | €11.15 / kg | $5.68 | 1.02 |
| United States | $5.57 / lb | $5.57 | 1.00 |
| China | CN¥80.50 / kg | $5.46 | 0.98 |
| Canada | C$7.59 / lb | $5.40 | 0.97 |
| United Kingdom | £8.80 / kg | $5.35 | 0.96 |
| Australia | A$16.60 / kg | $5.29 | 0.95 |
| United Arab Emirates | AED42.84 / kg | $5.29 | 0.95 |
| Saudi Arabia | SAR42.83 / kg | $5.18 | 0.93 |
| India | ₹1,069 / kg | $5.12 | 0.92 |
| Bangladesh | ৳1,337 / kg | $4.90 | 0.88 |
| South Africa | R170.92 / kg | $4.73 | 0.85 |
How we produced this
The series are our own. Exchange settlements and published index data are pulled daily, converted into indicative scrap grades using published recovery shares, and stored as a five-year daily history. Percentage changes compare closes 252, 756 and roughly 1,250 sessions apart. Drawdown is measured as the largest peak-to-trough fall in the series.
Two limits are worth stating. The ferrous, lead, zinc and nickel series come from monthly published sources, so their intra-month detail is smoothed. And these are indicative reference prices, not the transaction prices at any particular yard; the shape of the history is reliable, an individual dollar figure for your grade at your yard is not something any index can give you.
The full derivation, including every recovery share, is on our editorial policy page. Today’s levels are on the live board and each market in local currency on the country pages. Data on world recycling volumes behind these markets is published by the Bureau of International Recycling and the World Steel Association.